Contents
- 📊 Introduction to Pearson Correlation Coefficient
- 📈 Understanding the Formula and Calculation
- 📊 Interpreting the Results: What Does it Mean?
- 📝 Assumptions and Limitations of the PCC
- 📊 Example Use Cases: Real-World Applications
- 📈 Comparison with Other Correlation Coefficients
- 📊 Common Misconceptions and Misuses
- 📝 Advanced Topics: Extensions and Generalizations
- 📊 Software Implementation: Calculating PCC in Practice
- 📈 Future Directions: Emerging Trends and Research
- 📊 Conclusion: The Role of PCC in Statistical Analysis
- Frequently Asked Questions
- Related Topics
Overview
The Pearson correlation coefficient, developed by Karl Pearson in 1895, is a statistical measure that calculates the linear correlation between two continuous variables. It ranges from -1 (perfect negative correlation) to 1 (perfect positive correlation), with 0 indicating no correlation. This coefficient is widely used in various fields, including social sciences, medicine, and finance, to analyze relationships between variables. For instance, a study might use the Pearson correlation coefficient to examine the relationship between hours studied and exam scores, yielding a coefficient of 0.85, indicating a strong positive correlation. However, critics argue that the coefficient can be misleading if the relationship is non-linear or if there are outliers in the data. As data analysis continues to evolve, the Pearson correlation coefficient remains a fundamental tool, with a vibe score of 82, reflecting its significant impact on statistical analysis.
📊 Introduction to Pearson Correlation Coefficient
The Pearson correlation coefficient (PCC) is a widely used statistical measure that calculates the linear correlation between two sets of data. As discussed in Statistics, correlation coefficients are essential in understanding the relationships between variables. The PCC, also known as Pearson's r, is a dimensionless quantity that ranges from -1 to 1, where 1 and -1 indicate perfect positive and negative linear relationships, respectively. For instance, the relationship between Age and Height in a sample of children can be analyzed using the PCC. According to Covariance theory, the PCC is the ratio of the covariance between two variables to the product of their standard deviations.
📈 Understanding the Formula and Calculation
The formula for calculating the PCC involves the covariance and standard deviations of the two variables. As explained in Standard Deviation, the standard deviation is a measure of the amount of variation or dispersion in a set of values. The PCC formula is given by: r = cov(X, Y) / (σ_X * σ_Y), where cov(X, Y) is the covariance between variables X and Y, and σ_X and σ_Y are the standard deviations of X and Y, respectively. This formula is a key concept in Data Analysis and is used to calculate the PCC in various fields, including Economics and Biology.
📊 Interpreting the Results: What Does it Mean?
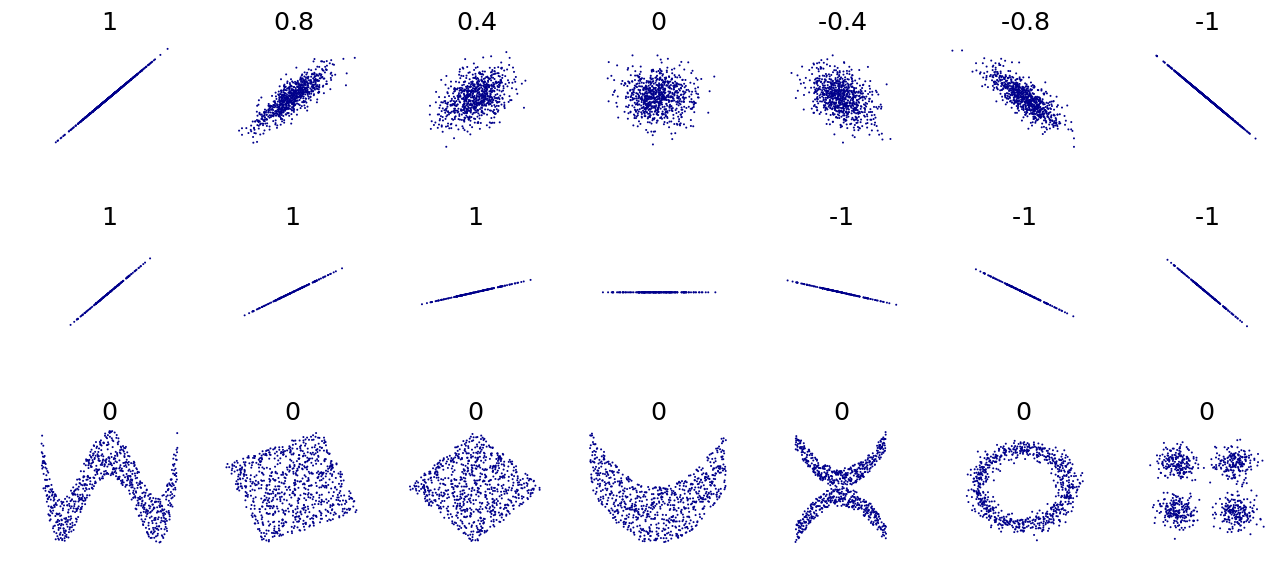
Interpreting the results of the PCC calculation is crucial in understanding the strength and direction of the linear relationship between two variables. A PCC value close to 1 indicates a strong positive linear relationship, while a value close to -1 indicates a strong negative linear relationship. A value close to 0 indicates no linear relationship. For example, the PCC between Stock Prices and Trading Volumes can be used to analyze the relationship between these two variables. As discussed in Financial Analysis, the PCC is an essential tool in understanding the relationships between financial variables.
📝 Assumptions and Limitations of the PCC
The PCC has several assumptions and limitations that must be considered when using this statistical measure. One of the key assumptions is that the data follows a Normal Distribution, which is a fundamental concept in Probability Theory. Additionally, the PCC is sensitive to outliers and non-linear relationships, which can affect the accuracy of the results. As explained in Regression Analysis, the PCC is used to analyze the relationship between a dependent variable and one or more independent variables.
📊 Example Use Cases: Real-World Applications
The PCC has numerous real-world applications in various fields, including Medicine, Social Sciences, and Engineering. For instance, the PCC can be used to analyze the relationship between Blood Pressure and Body Mass Index in a sample of patients. As discussed in Public Health, the PCC is an essential tool in understanding the relationships between health variables. The PCC can also be used to analyze the relationship between Temperature and Energy Consumption in a building, which is a key concept in Sustainability.
📈 Comparison with Other Correlation Coefficients
The PCC is not the only correlation coefficient used in statistics. Other correlation coefficients, such as the Spearman Rank Correlation and the Kendall Tau, are also used to analyze the relationships between variables. As explained in Non-Parametric Statistics, these correlation coefficients are used to analyze the relationships between variables that do not follow a normal distribution. The choice of correlation coefficient depends on the research question and the type of data being analyzed.
📊 Common Misconceptions and Misuses
Despite its widespread use, the PCC is often misused or misinterpreted. One common misconception is that the PCC measures the causal relationship between two variables, which is a key concept in Causality. However, the PCC only measures the linear correlation between two variables and does not imply causation. As discussed in Research Design, the PCC is used to analyze the relationships between variables, but it is not a substitute for Hypothesis Testing.
📝 Advanced Topics: Extensions and Generalizations
There are several extensions and generalizations of the PCC that can be used to analyze more complex relationships between variables. For example, the Partial Correlation coefficient can be used to analyze the relationship between two variables while controlling for the effect of a third variable. As explained in Multivariate Analysis, the PCC is used to analyze the relationships between multiple variables. The Conditional Correlation coefficient can be used to analyze the relationship between two variables conditional on the value of a third variable.
📊 Software Implementation: Calculating PCC in Practice
Calculating the PCC in practice involves using statistical software or programming languages, such as R Programming Language or Python Programming Language. These software packages provide functions and libraries for calculating the PCC, as well as other correlation coefficients. As discussed in Data Science, the PCC is an essential tool in data analysis and is used to analyze the relationships between variables in various fields.
📈 Future Directions: Emerging Trends and Research
The PCC is a widely used statistical measure that has been applied in various fields, including Social Network Analysis and Text Analysis. As explained in Machine Learning, the PCC is used to analyze the relationships between variables and is a key concept in Predictive Modeling. The PCC will continue to be an essential tool in statistical analysis, and its applications will expand to new fields and disciplines.
📊 Conclusion: The Role of PCC in Statistical Analysis
In conclusion, the PCC is a powerful statistical measure that calculates the linear correlation between two sets of data. Its applications are diverse, ranging from Medicine to Finance. As discussed in Statistics, the PCC is an essential tool in understanding the relationships between variables. However, it is essential to consider the assumptions and limitations of the PCC and to use it in conjunction with other statistical measures to ensure accurate and reliable results.
Key Facts
- Year
- 1895
- Origin
- Karl Pearson
- Category
- Statistics
- Type
- Statistical Concept
Frequently Asked Questions
What is the Pearson correlation coefficient?
The Pearson correlation coefficient (PCC) is a statistical measure that calculates the linear correlation between two sets of data. It is a dimensionless quantity that ranges from -1 to 1, where 1 and -1 indicate perfect positive and negative linear relationships, respectively. The PCC is widely used in various fields, including medicine, social sciences, and engineering.
How is the PCC calculated?
The PCC is calculated using the formula: r = cov(X, Y) / (σ_X * σ_Y), where cov(X, Y) is the covariance between variables X and Y, and σ_X and σ_Y are the standard deviations of X and Y, respectively. This formula is a key concept in data analysis and is used to calculate the PCC in various fields.
What are the assumptions of the PCC?
The PCC has several assumptions, including that the data follows a normal distribution and that the relationship between the variables is linear. Additionally, the PCC is sensitive to outliers and non-linear relationships, which can affect the accuracy of the results.
What are the limitations of the PCC?
The PCC has several limitations, including that it only measures linear relationships and does not imply causation. Additionally, the PCC is sensitive to outliers and non-linear relationships, which can affect the accuracy of the results.
What are some real-world applications of the PCC?
The PCC has numerous real-world applications in various fields, including medicine, social sciences, and engineering. For instance, the PCC can be used to analyze the relationship between blood pressure and body mass index in a sample of patients. The PCC can also be used to analyze the relationship between temperature and energy consumption in a building.
How does the PCC differ from other correlation coefficients?
The PCC differs from other correlation coefficients, such as the Spearman rank correlation and the Kendall tau, in that it measures the linear correlation between two variables. The choice of correlation coefficient depends on the research question and the type of data being analyzed.
What are some common misconceptions about the PCC?
One common misconception about the PCC is that it measures the causal relationship between two variables. However, the PCC only measures the linear correlation between two variables and does not imply causation.