Contents
- 🌎 Introduction to Geospatial Visualization
- 📊 The Science of Geospatial Data
- 🗺️ Mapping the Unseen: Applications and Use Cases
- 🔍 Geospatial Analysis: Techniques and Tools
- 📈 The Future of Geospatial Visualization
- 🤝 Collaboration and Community in Geospatial Visualization
- 📊 Geospatial Data Sources and Quality
- 🚀 Emerging Trends in Geospatial Visualization
- 📚 Education and Training in Geospatial Visualization
- 📊 Geospatial Visualization in Business and Industry
- 🌐 Global Geospatial Visualization Initiatives
- Frequently Asked Questions
- Related Topics
Overview
Geospatial visualization is a rapidly evolving field that combines geographic information systems (GIS), data visualization, and spatial analysis to communicate complex spatial data insights. Pioneers like John Snow, who mapped the 1854 London cholera outbreak, and modern-day companies like Esri and Google, have pushed the boundaries of geospatial visualization. With the rise of big data and IoT sensors, geospatial visualization has become a critical tool for urban planning, climate modeling, and emergency response. However, critics argue that geospatial visualization can also perpetuate biases and reinforce existing power structures. As the field continues to advance, it's essential to consider the social and ethical implications of geospatial visualization. According to a report by MarketsandMarkets, the geospatial analytics market is expected to reach $73.6 billion by 2025, growing at a Compound Annual Growth Rate (CAGR) of 15.6% during the forecast period. Researchers like Dr. Sarah Elwood have also explored the use of geospatial visualization in social justice movements, highlighting its potential to amplify marginalized voices.
🌎 Introduction to Geospatial Visualization
Geospatial visualization is a powerful tool for understanding and analyzing complex spatial data. By combining Geographic Information Systems (GIS) with data visualization techniques, geospatial visualization enables us to map and explore the unseen patterns and relationships in our world. From climate change to urban planning, geospatial visualization has a wide range of applications and use cases. As data science continues to evolve, geospatial visualization is becoming an increasingly important field of study. With the help of machine learning and artificial intelligence, geospatial visualization is capable of revealing new insights and patterns in large datasets.
📊 The Science of Geospatial Data
The science of geospatial data is based on the collection, analysis, and interpretation of spatial data. This involves the use of GPS technology, remote sensing, and GIS software to collect and analyze data on the Earth's surface. Geospatial data can be used to study a wide range of phenomena, from natural disasters to population growth. By applying statistical analysis and data mining techniques to geospatial data, researchers can identify patterns and trends that would be difficult to detect using other methods. For example, epidemiology uses geospatial data to track the spread of diseases and identify high-risk areas.
🗺️ Mapping the Unseen: Applications and Use Cases
Geospatial visualization has a wide range of applications and use cases, from environmental monitoring to transportation planning. By mapping the unseen patterns and relationships in our world, geospatial visualization can help us to better understand complex systems and make more informed decisions. For example, urban planning uses geospatial visualization to design more efficient and sustainable cities. Emergency response teams use geospatial visualization to quickly respond to natural disasters and other emergencies. Additionally, business intelligence uses geospatial visualization to analyze customer behavior and optimize marketing campaigns.
🔍 Geospatial Analysis: Techniques and Tools
Geospatial analysis involves the use of various techniques and tools to analyze and interpret spatial data. This includes the use of GIS software, spatial statistics, and machine learning algorithms. Geospatial analysis can be used to identify patterns and trends in large datasets, and to predict future outcomes based on historical data. For example, predictive maintenance uses geospatial analysis to predict when equipment is likely to fail, and supply chain optimization uses geospatial analysis to optimize logistics and transportation routes. Crime analysis also uses geospatial analysis to identify high-crime areas and predict future crime patterns.
📈 The Future of Geospatial Visualization
The future of geospatial visualization is exciting and rapidly evolving. With the increasing availability of big data and cloud computing, geospatial visualization is becoming more powerful and accessible than ever before. Augmented reality and virtual reality are also being used to create immersive and interactive geospatial visualizations. As IoT devices become more widespread, geospatial visualization will play an increasingly important role in smart cities and industrial automation. For example, smart transportation systems use geospatial visualization to optimize traffic flow and reduce congestion.
🤝 Collaboration and Community in Geospatial Visualization
Collaboration and community are essential components of geospatial visualization. By working together and sharing knowledge and resources, researchers and practitioners can advance the field and develop new applications and use cases. Open-source software and data sharing initiatives are helping to facilitate collaboration and community engagement in geospatial visualization. For example, OSGeo is a community-driven organization that promotes the use of open-source geospatial software. Geospatial standards are also being developed to ensure interoperability and compatibility between different systems and datasets.
📊 Geospatial Data Sources and Quality
Geospatial data sources and quality are critical components of geospatial visualization. High-quality data is essential for accurate and reliable analysis and visualization. Data validation and data cleaning are important steps in ensuring the quality of geospatial data. Data standards are also being developed to ensure consistency and interoperability between different datasets and systems. For example, FGDC is a US government agency that develops and promotes geospatial data standards. Data governance is also important for ensuring the security and integrity of geospatial data.
🚀 Emerging Trends in Geospatial Visualization
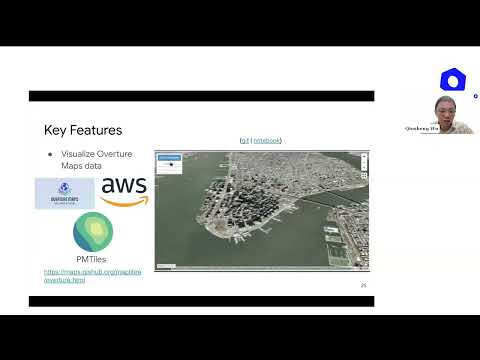
Emerging trends in geospatial visualization include the use of machine learning and deep learning algorithms to analyze and interpret large datasets. Computer vision is also being used to analyze and interpret visual data from drones and other IoT devices. Geospatial cloud computing is also becoming increasingly popular, as it provides a scalable and flexible platform for geospatial data analysis and visualization. For example, Amazon Web Services and Google Cloud offer geospatial cloud computing services.
📚 Education and Training in Geospatial Visualization
Education and training are essential components of geospatial visualization. As the field continues to evolve, it is important for researchers and practitioners to stay up-to-date with the latest techniques and tools. Online courses and workshops are being offered by universities and professional organizations to provide training and education in geospatial visualization. For example, Coursera and edX offer online courses in geospatial visualization. Geospatial certification programs are also being developed to recognize expertise and competence in geospatial visualization.
📊 Geospatial Visualization in Business and Industry
Geospatial visualization has a wide range of applications in business and industry, from location-based marketing to supply chain optimization. By analyzing and visualizing geospatial data, businesses can gain valuable insights into customer behavior, market trends, and operational efficiency. Business intelligence tools are being used to analyze and visualize geospatial data, and to develop predictive models and forecasts. For example, Esri offers business intelligence tools for geospatial visualization. Market research also uses geospatial visualization to analyze customer behavior and preferences.
🌐 Global Geospatial Visualization Initiatives
Global geospatial visualization initiatives are being developed to promote the use of geospatial data and technology for sustainable development and social good. United Nations agencies such as UNESCAP and UNEP are promoting the use of geospatial technology for sustainable development. Geospatial for Good is a global initiative that promotes the use of geospatial technology for social good. For example, Google Earth is being used to monitor and track deforestation and climate change.
Key Facts
- Year
- 2022
- Origin
- Vibepedia
- Category
- Data Science
- Type
- Concept
Frequently Asked Questions
What is geospatial visualization?
Geospatial visualization is the process of creating visual representations of geospatial data to better understand and analyze complex spatial relationships and patterns. It combines Geographic Information Systems (GIS) with data visualization techniques to map and explore the unseen patterns and relationships in our world. Geospatial visualization has a wide range of applications, from environmental monitoring to urban planning.
What are the benefits of geospatial visualization?
The benefits of geospatial visualization include improved decision-making, increased efficiency, and enhanced understanding of complex spatial relationships and patterns. Geospatial visualization can help organizations to identify trends and patterns in large datasets, and to predict future outcomes based on historical data. It can also be used to communicate complex information to non-technical stakeholders, and to facilitate collaboration and community engagement. For example, emergency response teams use geospatial visualization to quickly respond to natural disasters and other emergencies.
What are the challenges of geospatial visualization?
The challenges of geospatial visualization include the need for high-quality data, the complexity of geospatial analysis, and the need for specialized skills and training. Geospatial data can be difficult to collect and analyze, and it requires specialized software and expertise to visualize and interpret. Additionally, geospatial visualization can be computationally intensive, and it requires significant resources and infrastructure to support large-scale analysis and visualization. For example, data validation and data cleaning are important steps in ensuring the quality of geospatial data.
What are the emerging trends in geospatial visualization?
The emerging trends in geospatial visualization include the use of machine learning and deep learning algorithms to analyze and interpret large datasets. Computer vision is also being used to analyze and interpret visual data from drones and other IoT devices. Geospatial cloud computing is also becoming increasingly popular, as it provides a scalable and flexible platform for geospatial data analysis and visualization. For example, Amazon Web Services and Google Cloud offer geospatial cloud computing services.
What are the applications of geospatial visualization in business and industry?
The applications of geospatial visualization in business and industry include location-based marketing, supply chain optimization, and business intelligence. Geospatial visualization can help businesses to gain valuable insights into customer behavior, market trends, and operational efficiency. It can also be used to develop predictive models and forecasts, and to facilitate collaboration and community engagement. For example, Esri offers business intelligence tools for geospatial visualization.
What are the global geospatial visualization initiatives?
The global geospatial visualization initiatives include the United Nations agencies such as UNESCAP and UNEP, which promote the use of geospatial technology for sustainable development. Geospatial for Good is a global initiative that promotes the use of geospatial technology for social good. For example, Google Earth is being used to monitor and track deforestation and climate change.
What is the future of geospatial visualization?
The future of geospatial visualization is exciting and rapidly evolving. With the increasing availability of big data and cloud computing, geospatial visualization is becoming more powerful and accessible than ever before. Augmented reality and virtual reality are also being used to create immersive and interactive geospatial visualizations. As IoT devices become more widespread, geospatial visualization will play an increasingly important role in smart cities and industrial automation.