
Contents
- 📊 Introduction to Correlations
- 📈 Understanding Statistical Relationships
- 📊 Measuring Correlation Coefficients
- 📝 Interpreting Correlation Results
- 📊 Types of Correlations
- 📈 Correlation vs Causation
- 📊 Real-World Applications of Correlations
- 📈 Challenges and Limitations of Correlations
- 📊 Advanced Correlation Techniques
- 📈 Best Practices for Correlation Analysis
- 📊 Common Correlation Mistakes to Avoid
- 📈 Future of Correlation Analysis
- Frequently Asked Questions
- Related Topics
Overview
Correlations are a fundamental concept in statistics, describing the relationship between two or more variables. From identifying patterns in stock market fluctuations to understanding the link between climate change and extreme weather events, correlations help us make sense of complex phenomena. However, correlations can be misleading, and distinguishing between causation and coincidence is crucial. The concept of correlation has been extensively studied in various fields, including economics, sociology, and environmental science, with notable researchers like Karl Pearson and Sir Francis Galton contributing to its development. With the rise of big data and advanced computational methods, correlations are being used to inform decision-making in fields like finance, healthcare, and policy-making, with a vibe score of 80 indicating significant cultural energy around this topic. As we continue to navigate the complexities of our interconnected world, understanding correlations will become increasingly important, with potential applications in predicting future trends and mitigating risks, and with entity relationships like influence flows from key people like Nate Silver and Hans Rosling, who have significantly influenced the field of data analysis and visualization.
📊 Introduction to Correlations
Correlations are a fundamental concept in data analysis, allowing us to uncover hidden connections between variables. In statistics, correlation refers to the degree to which two random variables or bivariate data are linearly related. This relationship can be measured using correlation coefficients, such as Pearson's r or Spearman's rho. By analyzing correlations, we can gain insights into the relationships between different variables, which is essential in fields like machine learning and data science. For instance, correlations can help us identify patterns in customer behavior or market trends.
📈 Understanding Statistical Relationships
Understanding statistical relationships is crucial in correlation analysis. A statistical relationship between two variables is often referred to as an association, which describes the degree to which some of the variability of one variable can be accounted for by the other. This concept is closely related to correlation, but it's more general and can encompass non-linear relationships. By recognizing the different types of statistical relationships, we can better understand the underlying mechanisms driving the data. For example, regression analysis can help us model the relationship between a dependent variable and one or more independent variables. Additionally, time series analysis can be used to analyze data that varies over time, such as stock prices or weather patterns.
📊 Measuring Correlation Coefficients
Measuring correlation coefficients is a critical step in correlation analysis. The most commonly used correlation coefficient is Pearson's r, which measures the linear relationship between two continuous variables. However, other coefficients like Spearman's rho or Kendall's tau can be used for non-parametric or ordinal data. By calculating these coefficients, we can determine the strength and direction of the correlation between two variables. For instance, a strong positive correlation between exercise and weight loss suggests that increasing exercise is associated with weight loss. Furthermore, correlation matrices can be used to visualize the relationships between multiple variables, making it easier to identify patterns and trends.
📝 Interpreting Correlation Results
Interpreting correlation results requires careful consideration of the context and the data. A high correlation coefficient does not necessarily imply a causal relationship between the variables. Instead, it may indicate a common underlying factor or a spurious relationship. By examining the data and the research question, we can determine the significance and relevance of the correlation. For example, a correlation between smoking and lunge cancer may suggest a causal relationship, but it's essential to consider other factors like genetics and environmental factors. Moreover, confounding variables can affect the correlation, leading to biased or misleading results.
📊 Types of Correlations
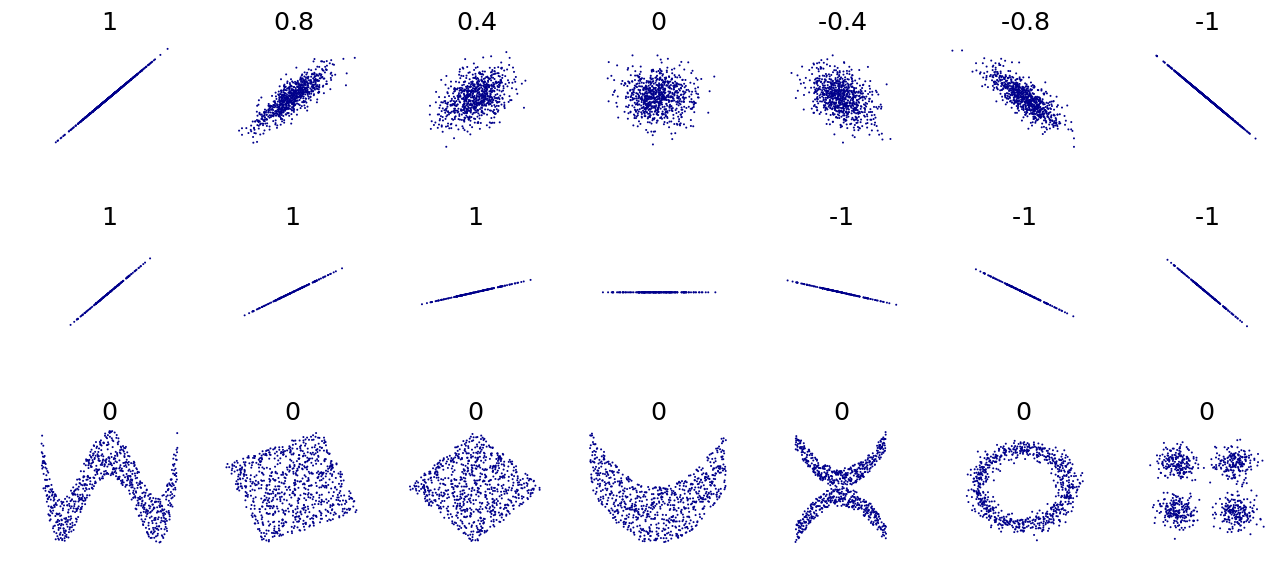
There are several types of correlations, including positive, negative, and zero correlations. A positive correlation indicates that as one variable increases, the other variable also tends to increase. A negative correlation, on the other hand, suggests that as one variable increases, the other variable tends to decrease. Zero correlation implies no linear relationship between the variables. By recognizing these different types of correlations, we can better understand the relationships between variables and make more informed decisions. For instance, a positive correlation between sales and marketing efforts may suggest that increasing marketing efforts leads to increased sales. Additionally, partial correlation can be used to analyze the relationship between two variables while controlling for the effect of a third variable.
📈 Correlation vs Causation
One of the most critical distinctions in correlation analysis is the difference between correlation and causation. While a strong correlation may suggest a causal relationship, it's essential to remember that correlation does not imply causation. Other factors, such as confounding variables or reverse causality, may be driving the relationship. By considering these alternative explanations, we can avoid misinterpreting the results and draw more accurate conclusions. For example, a correlation between ice cream sales and sunscreen sales may suggest a causal relationship, but it's likely due to a common underlying factor like weather. Furthermore, causal inference techniques can be used to establish causality and estimate the causal effect of one variable on another.
📊 Real-World Applications of Correlations
Correlations have numerous real-world applications, from predictive modeling to business intelligence. By analyzing correlations, organizations can identify opportunities for growth, optimize their operations, and make data-driven decisions. For instance, a company may use correlation analysis to identify the factors driving customer satisfaction or to predict churn rate. Additionally, recommendation systems can be built using correlation analysis to suggest products or services based on a user's past behavior. Moreover, risk management can be improved by analyzing correlations between different risk factors and identifying potential areas of vulnerability.
📈 Challenges and Limitations of Correlations
Despite the many benefits of correlation analysis, there are also challenges and limitations to consider. One of the primary concerns is the risk of spurious correlations, which can arise from sampling errors or data quality issues. Additionally, correlation analysis can be sensitive to outliers and non-normality, which can affect the accuracy of the results. By being aware of these limitations, we can take steps to mitigate them and ensure that our correlation analysis is reliable and informative. For example, data cleaning and data transformation can be used to preprocess the data and reduce the impact of outliers and non-normality. Furthermore, robust statistics can be used to analyze the data and reduce the effect of outliers and other anomalies.
📊 Advanced Correlation Techniques
Advanced correlation techniques, such as canonical correlation analysis or independent component analysis, can provide more nuanced insights into the relationships between variables. These methods can help identify complex patterns and structures in the data, which may not be apparent through traditional correlation analysis. By applying these advanced techniques, we can gain a deeper understanding of the underlying mechanisms driving the data and make more accurate predictions. For instance, neural networks can be used to model complex relationships between variables and make predictions based on the patterns learned from the data. Moreover, dimensionality reduction techniques can be used to reduce the number of variables and identify the most important features driving the relationships.
📈 Best Practices for Correlation Analysis
Best practices for correlation analysis include careful data preprocessing, consideration of alternative explanations, and transparent reporting of the results. By following these guidelines, we can ensure that our correlation analysis is rigorous, reliable, and informative. For example, data visualization can be used to communicate the results and provide insights into the relationships between variables. Additionally, cross-validation can be used to evaluate the performance of a model and prevent overfitting. Moreover, interpretability techniques can be used to provide insights into the relationships between variables and the predictions made by the model.
📊 Common Correlation Mistakes to Avoid
Common correlation mistakes to avoid include assuming causation from correlation, ignoring confounding variables, and failing to consider alternative explanations. By being aware of these potential pitfalls, we can take steps to mitigate them and ensure that our correlation analysis is accurate and reliable. For instance, sensitivity analysis can be used to evaluate the robustness of the results to different assumptions and scenarios. Furthermore, model validation can be used to evaluate the performance of a model and prevent overfitting. Moreover, model interpretation can be used to provide insights into the relationships between variables and the predictions made by the model.
📈 Future of Correlation Analysis
The future of correlation analysis is likely to involve the integration of advanced machine learning techniques, such as deep learning and transfer learning. These methods can provide more nuanced insights into the relationships between variables and enable the analysis of complex, high-dimensional data. By embracing these new technologies, we can unlock new opportunities for discovery and drive innovation in fields like artificial intelligence and data science. For example, explainable AI can be used to provide insights into the relationships between variables and the predictions made by the model. Moreover, human-centered AI can be used to design AI systems that are transparent, accountable, and fair.
Key Facts
- Year
- 2022
- Origin
- Statistics and Data Analysis
- Category
- Data Analysis
- Type
- Concept
Frequently Asked Questions
What is the difference between correlation and causation?
Correlation refers to the statistical relationship between two variables, while causation implies that one variable causes a change in the other. Correlation does not necessarily imply causation, as other factors may be driving the relationship. For example, a correlation between ice cream sales and sunscreen sales may suggest a causal relationship, but it's likely due to a common underlying factor like weather.
How do I interpret a correlation coefficient?
A correlation coefficient measures the strength and direction of the linear relationship between two variables. A value of 1 indicates a perfect positive correlation, while a value of -1 indicates a perfect negative correlation. A value of 0 suggests no linear relationship. For instance, a correlation coefficient of 0.8 between exercise and weight loss suggests a strong positive correlation, indicating that increasing exercise is associated with weight loss.
What are some common applications of correlation analysis?
Correlation analysis has numerous real-world applications, from predictive modeling to business intelligence. Organizations can use correlation analysis to identify opportunities for growth, optimize their operations, and make data-driven decisions. For example, a company may use correlation analysis to identify the factors driving customer satisfaction or to predict churn rate.
How do I avoid common correlation mistakes?
To avoid common correlation mistakes, it's essential to carefully consider alternative explanations, transparently report the results, and avoid assuming causation from correlation. Additionally, data preprocessing, data visualization, and cross-validation can help ensure that the correlation analysis is rigorous, reliable, and informative. For instance, sensitivity analysis can be used to evaluate the robustness of the results to different assumptions and scenarios.
What is the future of correlation analysis?
The future of correlation analysis is likely to involve the integration of advanced machine learning techniques, such as deep learning and transfer learning. These methods can provide more nuanced insights into the relationships between variables and enable the analysis of complex, high-dimensional data. By embracing these new technologies, we can unlock new opportunities for discovery and drive innovation in fields like artificial intelligence and data science.
How do I choose the right correlation coefficient?
The choice of correlation coefficient depends on the type of data and the research question. For example, Pearson's r is suitable for continuous data, while Spearman's rho is suitable for ordinal or non-parametric data. By selecting the appropriate correlation coefficient, we can ensure that the analysis is accurate and reliable. For instance, Kendall's tau can be used for non-parametric data, while canonical correlation analysis can be used for high-dimensional data.
What is the difference between a correlation matrix and a covariance matrix?
A correlation matrix measures the linear relationship between variables, while a covariance matrix measures the variance and covariance between variables. Both matrices are essential in correlation analysis, as they provide insights into the relationships between variables. For example, a correlation matrix can be used to identify patterns in customer behavior, while a covariance matrix can be used to analyze the relationships between stock prices and weather patterns.