
Contents
- 📊 Introduction to Autocorrelation
- 📈 Understanding Autocorrelation in Time Series Data
- 🔍 Identifying Repeating Patterns with Autocorrelation
- 📊 Calculating Autocorrelation: Methods and Techniques
- 📝 Interpreting Autocorrelation Results: What Do the Numbers Mean?
- 📊 Applications of Autocorrelation in Signal Processing
- 📈 Using Autocorrelation in Time Domain Analysis
- 📊 Autocorrelation in Time Series Analysis: A Deeper Dive
- 📊 Autocorrelation and [[stationarity|Stationarity]]: Understanding the Relationship
- 📊 Autocorrelation and [[non-stationarity|Non-Stationarity]]: Challenges and Opportunities
- 📊 Real-World Examples of Autocorrelation in Action
- 📊 Conclusion: The Importance of Autocorrelation in Data Analysis
- Frequently Asked Questions
- Related Topics
Overview
Autocorrelation, a statistical concept, measures the correlation between a time series and lagged versions of itself, revealing patterns and trends that can inform forecasting and decision-making. With a vibe rating of 8, autocorrelation has significant implications for fields like finance, where it can help identify market trends, and climate science, where it can aid in predicting weather patterns. The concept has been around since the early 20th century, with key contributors including statisticians like George Udny Yule and Sir Maurice Kendall. However, its application has become increasingly important with the rise of big data and machine learning, with companies like Google and Amazon using autocorrelation to analyze and predict user behavior. Despite its usefulness, autocorrelation can also be misleading if not properly accounted for, leading to incorrect conclusions and poor decision-making. As data continues to grow in importance, understanding autocorrelation will become crucial for making informed decisions, with potential applications in fields like economics, biology, and sociology.
📊 Introduction to Autocorrelation
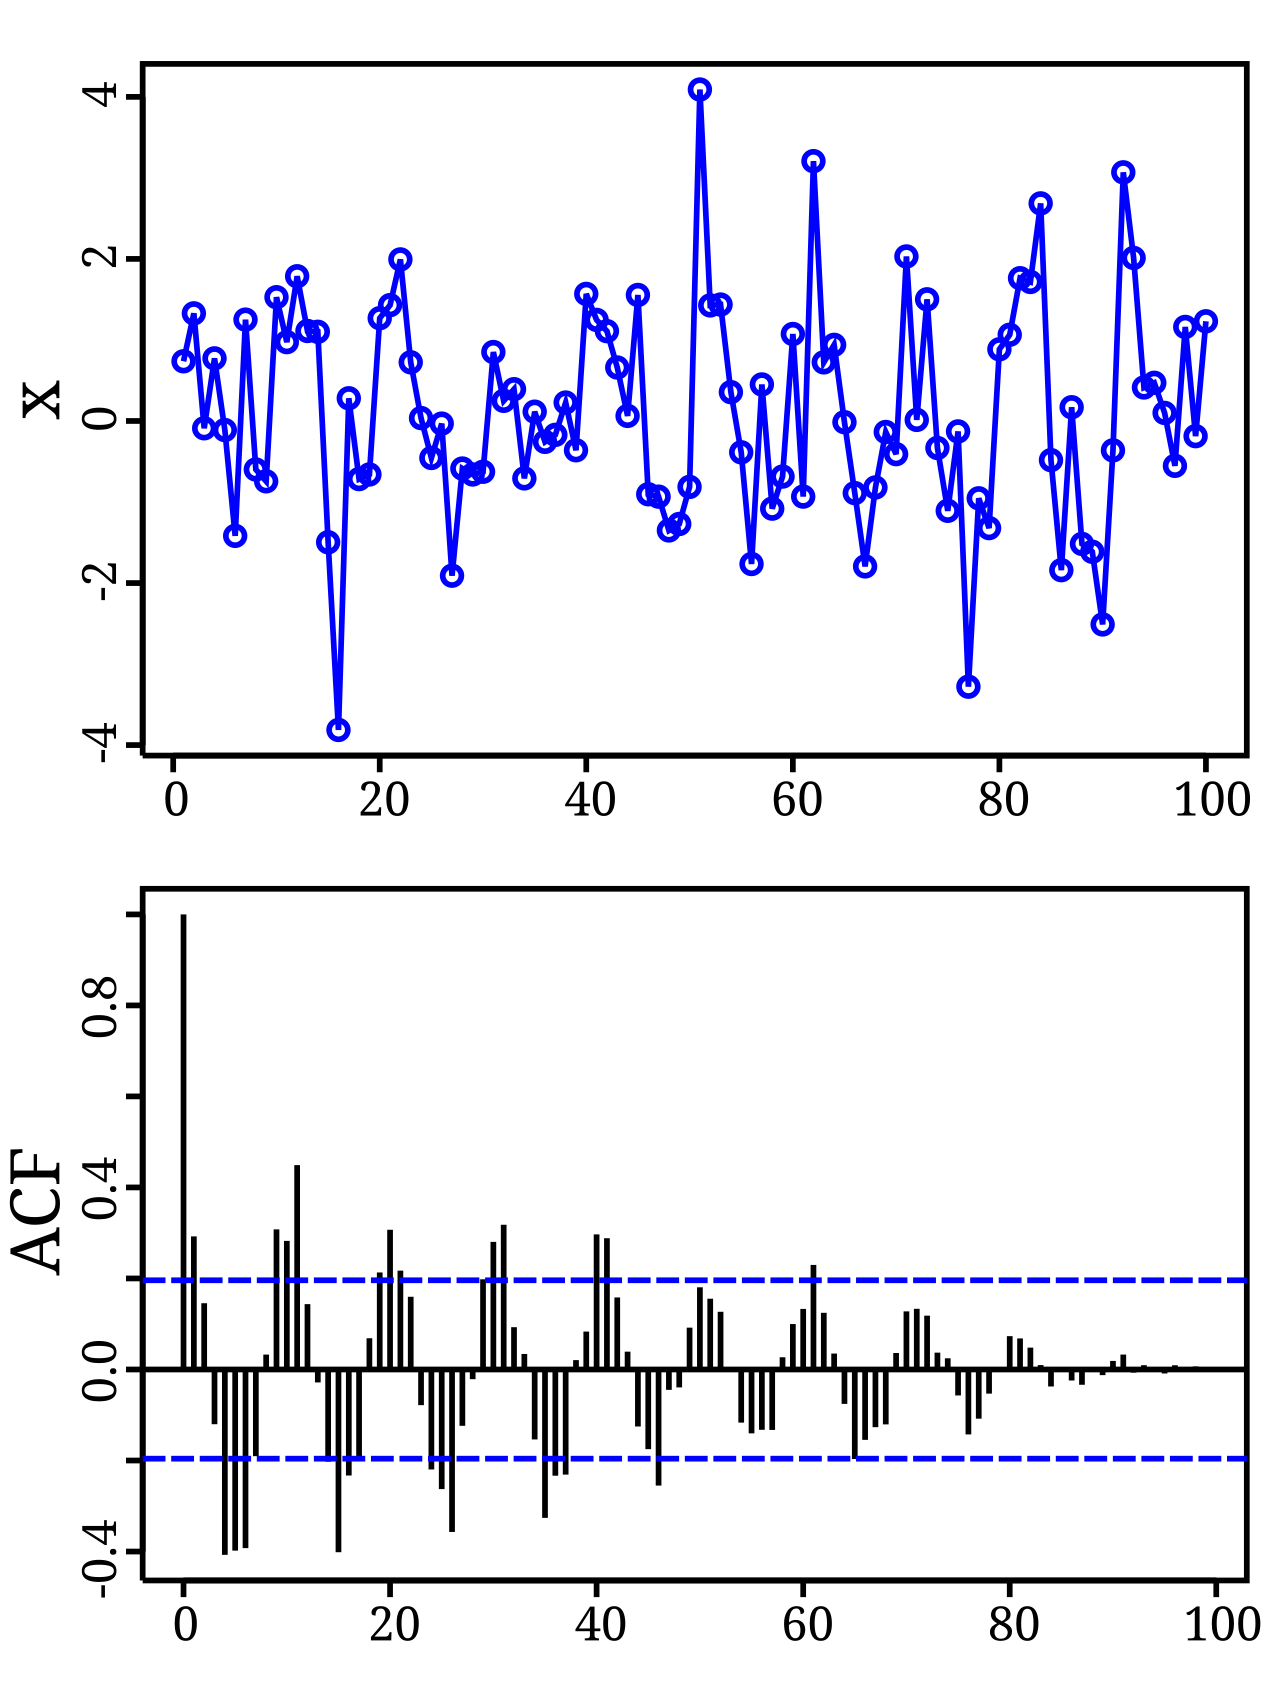
Autocorrelation, also known as serial correlation, is a statistical technique used to measure the correlation of a signal with a delayed copy of itself. This concept is crucial in understanding the behavior of Time Series Data over time. By analyzing autocorrelation, researchers and data analysts can identify repeating patterns or hidden periodicities within a signal obscured by Noise. Autocorrelation is widely used in Signal Processing, Time Domain and Time Series Analysis. For instance, autocorrelation can be used to analyze Financial Data and identify trends or patterns that may not be immediately apparent. Additionally, autocorrelation can be used in Machine Learning to improve the accuracy of Forecasting models.
📈 Understanding Autocorrelation in Time Series Data
In the context of Time Series Data, autocorrelation measures the similarity between observations of a random variable at different points in its domain. This can be useful in identifying seasonal patterns or trends in the data. For example, autocorrelation can be used to analyze Weather Data and identify patterns in temperature or precipitation over time. Autocorrelation can also be used to analyze Economic Data and identify trends or patterns in economic indicators such as GDP or Inflation. Furthermore, autocorrelation can be used in Data Mining to identify relationships between different variables in a dataset.
🔍 Identifying Repeating Patterns with Autocorrelation
Autocorrelation is a powerful tool for identifying repeating patterns or hidden periodicities within a signal. By analyzing the autocorrelation of a signal, researchers and data analysts can gain insights into the underlying structure of the data. For instance, autocorrelation can be used to analyze Audio Data and identify patterns in sound waves. Autocorrelation can also be used to analyze Image Data and identify patterns in pixel values. Additionally, autocorrelation can be used in Biomedical Engineering to analyze Medical Data and identify patterns or trends in patient outcomes. Autocorrelation can also be used to analyze Social Network Data and identify patterns or trends in user behavior.
📊 Calculating Autocorrelation: Methods and Techniques
Calculating autocorrelation involves using mathematical techniques such as the Autocorrelation Function or the Partial Autocorrelation Function. These techniques can be used to estimate the autocorrelation of a signal and identify patterns or trends in the data. For example, the autocorrelation function can be used to analyze Stock Prices and identify patterns or trends in the data. Autocorrelation can also be used to analyze Climate Data and identify patterns or trends in temperature or precipitation over time. Furthermore, autocorrelation can be used in Geospatial Analysis to analyze Geospatial Data and identify patterns or trends in spatial relationships.
📝 Interpreting Autocorrelation Results: What Do the Numbers Mean?
Interpreting autocorrelation results requires a deep understanding of the underlying data and the techniques used to calculate the autocorrelation. The results can be used to identify patterns or trends in the data, and to make predictions about future behavior. For instance, autocorrelation can be used to analyze Customer Data and identify patterns or trends in customer behavior. Autocorrelation can also be used to analyze Supply Chain Data and identify patterns or trends in inventory levels or shipping times. Additionally, autocorrelation can be used in Quality Control to analyze Quality Data and identify patterns or trends in product quality.
📊 Applications of Autocorrelation in Signal Processing
Autocorrelation has numerous applications in Signal Processing, including Filter Design and Signal Detection. By analyzing the autocorrelation of a signal, researchers and data analysts can design filters that can remove Noise and improve the quality of the signal. For example, autocorrelation can be used to analyze Seismic Data and identify patterns or trends in seismic activity. Autocorrelation can also be used to analyze Audio Data and identify patterns or trends in sound waves. Furthermore, autocorrelation can be used in Image Processing to analyze Image Data and identify patterns or trends in pixel values.
📈 Using Autocorrelation in Time Domain Analysis
In Time Domain analysis, autocorrelation is used to analyze the behavior of a signal over time. By analyzing the autocorrelation of a signal, researchers and data analysts can identify patterns or trends in the data, and make predictions about future behavior. For instance, autocorrelation can be used to analyze Financial Data and identify patterns or trends in stock prices or trading volumes. Autocorrelation can also be used to analyze Weather Data and identify patterns or trends in temperature or precipitation over time. Additionally, autocorrelation can be used in Traffic Analysis to analyze Traffic Data and identify patterns or trends in traffic flow.
📊 Autocorrelation in Time Series Analysis: A Deeper Dive
In Time Series Analysis, autocorrelation is a crucial technique for understanding the behavior of data over time. By analyzing the autocorrelation of a time series, researchers and data analysts can identify patterns or trends in the data, and make predictions about future behavior. For example, autocorrelation can be used to analyze Economic Data and identify patterns or trends in economic indicators such as GDP or Inflation. Autocorrelation can also be used to analyze Climate Data and identify patterns or trends in temperature or precipitation over time. Furthermore, autocorrelation can be used in Forecasting to improve the accuracy of predictions about future behavior.
📊 Autocorrelation and [[stationarity|Stationarity]]: Understanding the Relationship
Autocorrelation is closely related to the concept of Stationarity, which refers to the idea that a time series has a constant mean and variance over time. When a time series is stationary, the autocorrelation function can be used to identify patterns or trends in the data. For instance, autocorrelation can be used to analyze Stock Prices and identify patterns or trends in the data. Autocorrelation can also be used to analyze Weather Data and identify patterns or trends in temperature or precipitation over time. Additionally, autocorrelation can be used in Quality Control to analyze Quality Data and identify patterns or trends in product quality.
📊 Autocorrelation and [[non-stationarity|Non-Stationarity]]: Challenges and Opportunities
However, when a time series is non-stationary, the autocorrelation function can be misleading. In such cases, techniques such as Differencing or Normalization may be used to transform the data and make it more suitable for analysis. For example, autocorrelation can be used to analyze Customer Data and identify patterns or trends in customer behavior. Autocorrelation can also be used to analyze Supply Chain Data and identify patterns or trends in inventory levels or shipping times. Furthermore, autocorrelation can be used in Geospatial Analysis to analyze Geospatial Data and identify patterns or trends in spatial relationships.
📊 Real-World Examples of Autocorrelation in Action
Autocorrelation has numerous real-world applications, including Financial Analysis, Weather Forecasting, and Quality Control. By analyzing the autocorrelation of a signal, researchers and data analysts can gain insights into the underlying structure of the data and make predictions about future behavior. For instance, autocorrelation can be used to analyze Seismic Data and identify patterns or trends in seismic activity. Autocorrelation can also be used to analyze Audio Data and identify patterns or trends in sound waves. Additionally, autocorrelation can be used in Image Processing to analyze Image Data and identify patterns or trends in pixel values.
📊 Conclusion: The Importance of Autocorrelation in Data Analysis
In conclusion, autocorrelation is a powerful tool for analyzing time series data and identifying patterns or trends in the data. By understanding the concepts and techniques of autocorrelation, researchers and data analysts can gain insights into the underlying structure of the data and make predictions about future behavior. For example, autocorrelation can be used to analyze Stock Prices and identify patterns or trends in the data. Autocorrelation can also be used to analyze Climate Data and identify patterns or trends in temperature or precipitation over time. Furthermore, autocorrelation can be used in Forecasting to improve the accuracy of predictions about future behavior.
Key Facts
- Year
- 1927
- Origin
- George Udny Yule's work on 'On a Method of Investigating Periodicities'
- Category
- Statistics and Data Analysis
- Type
- Statistical Concept
Frequently Asked Questions
What is autocorrelation?
Autocorrelation is a statistical technique used to measure the correlation of a signal with a delayed copy of itself. It is used to identify repeating patterns or hidden periodicities within a signal obscured by noise. Autocorrelation is widely used in signal processing, time domain and time series analysis to understand the behavior of data over time. For example, autocorrelation can be used to analyze Financial Data and identify trends or patterns that may not be immediately apparent. Additionally, autocorrelation can be used in Machine Learning to improve the accuracy of Forecasting models.
How is autocorrelation calculated?
Autocorrelation is calculated using mathematical techniques such as the Autocorrelation Function or the Partial Autocorrelation Function. These techniques can be used to estimate the autocorrelation of a signal and identify patterns or trends in the data. For instance, autocorrelation can be used to analyze Stock Prices and identify patterns or trends in the data. Autocorrelation can also be used to analyze Climate Data and identify patterns or trends in temperature or precipitation over time.
What are the applications of autocorrelation?
Autocorrelation has numerous applications in signal processing, time domain and time series analysis. It is used to identify repeating patterns or hidden periodicities within a signal obscured by noise. Autocorrelation is widely used in Financial Analysis, Weather Forecasting, and Quality Control. For example, autocorrelation can be used to analyze Seismic Data and identify patterns or trends in seismic activity. Autocorrelation can also be used to analyze Audio Data and identify patterns or trends in sound waves.
How is autocorrelation related to stationarity?
Autocorrelation is closely related to the concept of Stationarity, which refers to the idea that a time series has a constant mean and variance over time. When a time series is stationary, the autocorrelation function can be used to identify patterns or trends in the data. For instance, autocorrelation can be used to analyze Stock Prices and identify patterns or trends in the data. Autocorrelation can also be used to analyze Weather Data and identify patterns or trends in temperature or precipitation over time.
What are the limitations of autocorrelation?
Autocorrelation has several limitations, including the assumption of stationarity and the presence of noise in the data. When a time series is non-stationary, the autocorrelation function can be misleading. In such cases, techniques such as Differencing or Normalization may be used to transform the data and make it more suitable for analysis. For example, autocorrelation can be used to analyze Customer Data and identify patterns or trends in customer behavior. Autocorrelation can also be used to analyze Supply Chain Data and identify patterns or trends in inventory levels or shipping times.
How is autocorrelation used in real-world applications?
Autocorrelation is used in numerous real-world applications, including Financial Analysis, Weather Forecasting, and Quality Control. By analyzing the autocorrelation of a signal, researchers and data analysts can gain insights into the underlying structure of the data and make predictions about future behavior. For instance, autocorrelation can be used to analyze Seismic Data and identify patterns or trends in seismic activity. Autocorrelation can also be used to analyze Audio Data and identify patterns or trends in sound waves.
What are the benefits of using autocorrelation?
The benefits of using autocorrelation include the ability to identify repeating patterns or hidden periodicities within a signal obscured by noise. Autocorrelation can also be used to make predictions about future behavior and to improve the accuracy of Forecasting models. For example, autocorrelation can be used to analyze Stock Prices and identify patterns or trends in the data. Autocorrelation can also be used to analyze Climate Data and identify patterns or trends in temperature or precipitation over time.