
Contents
- 📊 Introduction to Measures of Central Tendency
- 📈 Understanding Mean: The Most Common Measure
- 📊 Exploring Median: The Middle Value
- 📈 Delving into Mode: The Most Frequent Value
- 📊 The Relationship Between Mean, Median, and Mode
- 📈 Skewed Distributions: When Mean, Median, and Mode Diverge
- 📊 Choosing the Right Measure of Central Tendency
- 📈 Real-World Applications of Measures of Central Tendency
- 📊 Common Misconceptions and Pitfalls
- 📈 Advanced Topics in Measures of Central Tendency
- 📊 Conclusion: The Importance of Understanding Central Tendency
- Frequently Asked Questions
- Related Topics
Overview
Measures of central tendency are the statistical tools used to describe the middle or typical value of a dataset, including the mean, median, and mode. The mean, or average, is the most commonly used measure, but it can be skewed by outliers, whereas the median is more robust but less sensitive to changes in the data. The mode, the most frequently occurring value, is often overlooked but provides valuable insights into the distribution of data. With a vibe score of 8, measures of central tendency have a significant cultural resonance, particularly in fields like economics and social sciences, where understanding the 'typical' case is crucial. The concept has been debated by statisticians and data scientists, with some arguing that the mean is overused and others advocating for a more nuanced approach. As data analysis continues to evolve, the importance of measures of central tendency will only grow, with potential applications in AI and machine learning. The influence of pioneers like Carl Friedrich Gauss and Ronald Fisher can still be felt, shaping the way we think about data today.
📊 Introduction to Measures of Central Tendency
Measures of central tendency are a crucial concept in Statistics, as they provide a way to describe the central or typical value of a Probability Distribution. The three main measures of central tendency are the Mean, Median, and Mode. Each of these measures has its own strengths and weaknesses, and understanding when to use each is essential for effective data analysis. For example, the mean is sensitive to Outliers, while the median is more robust. The mode, on the other hand, is useful for describing categorical data. By understanding the different measures of central tendency, data analysts can gain a deeper insight into the characteristics of their data, as discussed in Data Analysis.
📈 Understanding Mean: The Most Common Measure
The mean is the most common measure of central tendency, and is calculated by summing all the values in a dataset and dividing by the number of values. However, the mean can be influenced by extreme values, or Outliers, which can skew the result. For instance, if a dataset contains a few very large or very small values, the mean may not accurately represent the typical value. In such cases, the Median or Mode may be a more suitable measure of central tendency. The mean is also closely related to the concept of Standard Deviation, which measures the spread of a dataset. As explained in Statistics for Dummies, understanding the mean and standard deviation is essential for making informed decisions based on data.
📊 Exploring Median: The Middle Value
The median is the middle value in a dataset when it is sorted in order. If there are an even number of values, the median is the average of the two middle values. The median is a more robust measure of central tendency than the mean, as it is less affected by extreme values. For example, in a dataset with a few very large values, the median may be a better representation of the typical value than the mean. The median is also useful for describing skewed distributions, where the mean may not accurately represent the data. As discussed in Data Science, the median is an important concept in understanding the characteristics of a dataset. Additionally, the median is closely related to the concept of Percentile, which measures the proportion of values below a certain threshold.
📈 Delving into Mode: The Most Frequent Value
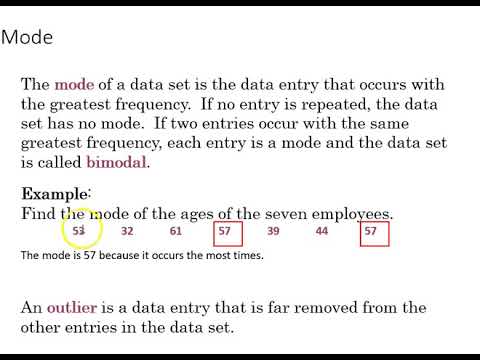
The mode is the most frequent value in a dataset. A dataset may have multiple modes if there are several values that appear with the same frequency. The mode is a useful measure of central tendency for categorical data, where the mean and median may not be applicable. For instance, in a dataset of colors, the mode may be the most common color. The mode is also useful for describing distributions with multiple peaks, where the mean and median may not accurately represent the data. As explained in Machine Learning, understanding the mode is essential for building effective models. Furthermore, the mode is closely related to the concept of Frequency Distribution, which describes the number of times each value appears in a dataset.
📊 The Relationship Between Mean, Median, and Mode
The relationship between the mean, median, and mode is complex and depends on the shape of the distribution. In a symmetric distribution, the mean, median, and mode are all equal. However, in a skewed distribution, the mean, median, and mode may be different. For example, in a distribution with a long tail to the right, the mean may be greater than the median, which may be greater than the mode. Understanding the relationship between the mean, median, and mode is essential for choosing the right measure of central tendency for a particular dataset, as discussed in Data Visualization. The mean, median, and mode are also closely related to the concept of Data Distribution, which describes the shape of the data.
📈 Skewed Distributions: When Mean, Median, and Mode Diverge
Skewed distributions are a common challenge in data analysis, as they can affect the accuracy of measures of central tendency. A skewed distribution is one that is not symmetric, and may have a long tail to one side. In such cases, the mean may not accurately represent the typical value, and the median or mode may be a more suitable measure of central tendency. For example, in a dataset of incomes, the mean may be skewed by a few very high incomes, while the median may be a more accurate representation of the typical income. As explained in Statistics with Python, understanding skewed distributions is essential for building effective models. Additionally, skewed distributions are closely related to the concept of Robust Statistics, which provides methods for analyzing data that are resistant to outliers and other anomalies.
📊 Choosing the Right Measure of Central Tendency
Choosing the right measure of central tendency depends on the shape of the distribution and the type of data. For symmetric distributions, the mean is often the best choice. However, for skewed distributions, the median or mode may be more suitable. For categorical data, the mode is often the best choice. It is also important to consider the level of measurement of the data, as some measures of central tendency may not be applicable to certain types of data. For example, the mean is not applicable to ordinal data, while the median and mode may be. As discussed in Research Methods, understanding the level of measurement is essential for choosing the right statistical methods. Furthermore, the level of measurement is closely related to the concept of Measurement Theory, which provides a framework for understanding the properties of measurement scales.
📈 Real-World Applications of Measures of Central Tendency
Measures of central tendency have many real-world applications, from business to medicine. For example, in business, the mean and median are often used to describe the typical customer or employee. In medicine, the mean and median are used to describe the typical patient outcome. The mode is also used in marketing to describe the most common customer preference. As explained in Business Analytics, understanding measures of central tendency is essential for making informed decisions. Additionally, measures of central tendency are closely related to the concept of Predictive Modeling, which provides methods for forecasting future outcomes based on historical data.
📊 Common Misconceptions and Pitfalls
There are several common misconceptions and pitfalls when it comes to measures of central tendency. One common mistake is to assume that the mean is always the best measure of central tendency. However, this is not always the case, especially for skewed distributions. Another mistake is to ignore the level of measurement of the data, which can affect the choice of measure of central tendency. As discussed in Statistical Mistakes, understanding these pitfalls is essential for avoiding errors in data analysis. Furthermore, common misconceptions and pitfalls are closely related to the concept of Statistical Literacy, which provides a framework for understanding the principles of statistical analysis.
📈 Advanced Topics in Measures of Central Tendency
There are several advanced topics in measures of central tendency, including the use of Robust Statistics and Non-Parametric Statistics. Robust statistics provide methods for analyzing data that are resistant to outliers and other anomalies. Non-parametric statistics provide methods for analyzing data that do not require a specific distribution. As explained in Advanced Statistics, understanding these topics is essential for building effective models. Additionally, advanced topics in measures of central tendency are closely related to the concept of Machine Learning, which provides methods for building predictive models from data.
📊 Conclusion: The Importance of Understanding Central Tendency
In conclusion, measures of central tendency are a crucial concept in statistics, and understanding them is essential for effective data analysis. By choosing the right measure of central tendency, data analysts can gain a deeper insight into the characteristics of their data. As discussed in Data Science, understanding measures of central tendency is essential for making informed decisions based on data. Furthermore, measures of central tendency are closely related to the concept of Data-Driven Decision Making, which provides a framework for using data to inform business decisions. The future of data analysis will likely involve the development of new measures of central tendency, as well as the application of existing measures to new and complex datasets.
Key Facts
- Year
- 1817
- Origin
- Carl Friedrich Gauss' work on the method of least squares
- Category
- Statistics
- Type
- Concept
Frequently Asked Questions
What is the difference between the mean, median, and mode?
The mean is the average value of a dataset, the median is the middle value, and the mode is the most frequent value. The choice of measure of central tendency depends on the shape of the distribution and the type of data. For example, the mean is sensitive to outliers, while the median is more robust. The mode is useful for describing categorical data. As explained in Statistics for Dummies, understanding the difference between the mean, median, and mode is essential for effective data analysis.
When should I use the mean, median, or mode?
The mean is suitable for symmetric distributions, while the median is more suitable for skewed distributions. The mode is suitable for categorical data. It is also important to consider the level of measurement of the data, as some measures of central tendency may not be applicable to certain types of data. As discussed in Research Methods, understanding the level of measurement is essential for choosing the right statistical methods.
What are some common misconceptions about measures of central tendency?
One common misconception is that the mean is always the best measure of central tendency. However, this is not always the case, especially for skewed distributions. Another misconception is that the median is always more robust than the mean. However, this is not always the case, and the choice of measure of central tendency depends on the specific characteristics of the data. As explained in Statistical Mistakes, understanding these misconceptions is essential for avoiding errors in data analysis.
How do measures of central tendency relate to other statistical concepts?
Measures of central tendency are closely related to other statistical concepts, such as Standard Deviation and Correlation. Understanding these relationships is essential for effective data analysis. For example, the mean and standard deviation are used to describe the shape of a distribution, while correlation is used to describe the relationship between two variables. As discussed in Statistics, understanding these relationships is essential for making informed decisions based on data.
What are some advanced topics in measures of central tendency?
Some advanced topics in measures of central tendency include the use of Robust Statistics and Non-Parametric Statistics. Robust statistics provide methods for analyzing data that are resistant to outliers and other anomalies. Non-parametric statistics provide methods for analyzing data that do not require a specific distribution. As explained in Advanced Statistics, understanding these topics is essential for building effective models.
How do measures of central tendency relate to data science?
Measures of central tendency are a crucial concept in Data Science, as they provide a way to describe the characteristics of a dataset. Understanding measures of central tendency is essential for making informed decisions based on data. As discussed in Data-Driven Decision Making, measures of central tendency are closely related to the concept of data-driven decision making, which provides a framework for using data to inform business decisions.
What are some real-world applications of measures of central tendency?
Measures of central tendency have many real-world applications, from business to medicine. For example, in business, the mean and median are often used to describe the typical customer or employee. In medicine, the mean and median are used to describe the typical patient outcome. The mode is also used in marketing to describe the most common customer preference. As explained in Business Analytics, understanding measures of central tendency is essential for making informed decisions based on data.