
Contents
- 📊 Introduction to Funnel Plots
- 📈 Understanding Publication Bias
- 📝 The Role of Funnel Plots in Systematic Reviews
- 📊 Interpreting Funnel Plot Results
- 📊 Types of Funnel Plots
- 📊 Common Applications of Funnel Plots
- 📊 Limitations and Challenges of Funnel Plots
- 📊 Future Directions for Funnel Plots
- 📊 Real-World Examples of Funnel Plots
- 📊 Best Practices for Creating Funnel Plots
- 📊 Conclusion: The Importance of Funnel Plots in Data Science
- Frequently Asked Questions
- Related Topics
Overview
The funnel plot, a statistical tool born out of the need to visualize and compare proportions, has been a cornerstone in meta-analyses and systematic reviews since its inception in the 1970s by Richard Light and Deborah Pillemer. This technique, with a vibe score of 7, has been widely adopted across various fields, including medicine, social sciences, and economics, to identify and explore potential sources of heterogeneity. However, skeptics argue that funnel plots can be misleading if not properly interpreted, particularly when dealing with small studies or those with significant publication bias. The plot's ability to reveal asymmetries and outliers has made it a crucial component in understanding the distribution of effect sizes, with influential figures like John Ioannidis contributing to its development and critique. As data science continues to evolve, the funnel plot remains a pivotal tool, with its influence flowing into contemporary methods of meta-analysis and systematic review. With a controversy spectrum rating of 6, indicating moderate debate, the funnel plot's future is intertwined with the advancement of statistical methodologies and the quest for transparency in research.
📊 Introduction to Funnel Plots
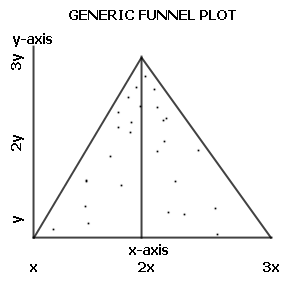
The funnel plot is a statistical tool used to detect publication bias in research studies. As discussed in publication bias articles, it is a graph that plots the effect size of studies against their precision, typically measured by the standard error. In the absence of publication bias, the plot should resemble a funnel, with studies with high precision clustered near the average effect size and studies with low precision spread out evenly on both sides. This concept is closely related to meta-analyses and systematic reviews, which aim to synthesize the results of multiple studies to draw more general conclusions. Funnel plots are an essential component of these reviews, as they help to identify potential biases that may influence the results. For instance, the Cochrane Collaboration relies heavily on funnel plots to ensure the quality of their reviews.
📈 Understanding Publication Bias
Publication bias occurs when the outcome of a study influences its likelihood of being published. This can lead to an overrepresentation of studies with significant results and an underrepresentation of studies with non-significant results. As a result, the overall estimate of the effect size may be biased, leading to incorrect conclusions. Funnel plots can help to detect this type of bias by visualizing the distribution of study results. If the plot is asymmetrical, with more studies on one side of the average effect size than the other, it may indicate publication bias. This concept is closely related to p-values and statistical significance, which are often used to determine the importance of study results. However, funnel plots provide a more nuanced view of the data, allowing researchers to identify potential biases that may not be apparent through other methods.
📝 The Role of Funnel Plots in Systematic Reviews
Systematic reviews and meta-analyses rely heavily on funnel plots to ensure the quality of the included studies. By examining the funnel plot, reviewers can identify potential publication bias and take steps to address it. For example, they may use trim and fill methods to impute missing studies and adjust the overall estimate of the effect size. This approach can help to reduce the impact of publication bias and provide a more accurate estimate of the true effect size. Funnel plots are also used in evidence-based medicine to evaluate the quality of clinical trials and other studies. By using funnel plots, researchers can identify areas where the evidence is weak or biased, and target future research efforts accordingly.
📊 Interpreting Funnel Plot Results
Interpreting funnel plot results requires a good understanding of the underlying statistics. The plot should be roughly symmetrical, with studies clustered near the average effect size and spreading out evenly on both sides. If the plot is asymmetrical, it may indicate publication bias. However, asymmetry can also be caused by other factors, such as heterogeneity between studies. Therefore, it is essential to consider the results of the funnel plot in conjunction with other statistical tests, such as Egger's test and Begg's test. These tests can help to confirm the presence of publication bias and provide a more comprehensive understanding of the data. Additionally, funnel plots can be used in conjunction with forest plots to visualize the results of individual studies and identify potential outliers.
📊 Types of Funnel Plots
There are several types of funnel plots, each with its own strengths and limitations. The most common type is the standard funnel plot, which plots the effect size against the standard error. However, other types of plots, such as contour-enhanced funnel plots and funnel plots with regression lines, can provide additional information and help to identify potential biases. For example, contour-enhanced funnel plots can help to identify areas of the plot where the density of studies is high, which may indicate publication bias. Funnel plots with regression lines can help to identify the relationship between the effect size and the standard error, which can provide insights into the underlying mechanisms of the studies.
📊 Common Applications of Funnel Plots
Funnel plots have a wide range of applications in data science, from clinical trials to social science research. They are particularly useful in fields where publication bias is a significant concern, such as pharmacology and psychology. By using funnel plots, researchers can identify potential biases and take steps to address them, which can help to improve the quality and validity of the research. Additionally, funnel plots can be used in data journalism to visualize the results of studies and identify potential biases in the data. This can help to promote transparency and accountability in research, and provide a more nuanced view of the data for readers.
📊 Limitations and Challenges of Funnel Plots
Despite their usefulness, funnel plots also have several limitations and challenges. One of the main limitations is that they rely on the assumption that the studies are randomly distributed around the true effect size. If this assumption is not met, the funnel plot may not accurately reflect the presence of publication bias. Additionally, funnel plots can be sensitive to the choice of statistical methods and the quality of the data. Therefore, it is essential to use funnel plots in conjunction with other statistical tests and to carefully evaluate the quality of the data before drawing conclusions. Furthermore, funnel plots can be used in conjunction with sensitivity analysis to evaluate the robustness of the results to different assumptions and methods.
📊 Future Directions for Funnel Plots
The future of funnel plots is likely to involve the development of new statistical methods and tools to improve their accuracy and usefulness. For example, machine learning algorithms can be used to identify patterns in the data that may indicate publication bias. Additionally, the development of new types of funnel plots, such as interactive funnel plots, can help to promote transparency and accountability in research. These plots can be used to visualize the results of studies in real-time, and to identify potential biases and areas for further research. Furthermore, funnel plots can be used in conjunction with data visualization tools to provide a more comprehensive view of the data and to identify potential patterns and trends.
📊 Real-World Examples of Funnel Plots
Funnel plots have been used in a wide range of real-world applications, from medical research to social science research. For example, a study on the effectiveness of a new medication may use a funnel plot to identify potential publication bias in the results. By examining the funnel plot, researchers can identify areas where the evidence is weak or biased, and target future research efforts accordingly. Additionally, funnel plots can be used in policy making to evaluate the effectiveness of different interventions and to identify areas for further research. This can help to promote evidence-based decision making and to improve the quality and validity of the research.
📊 Best Practices for Creating Funnel Plots
Best practices for creating funnel plots involve carefully evaluating the quality of the data and using appropriate statistical methods. It is essential to use a clear and concise title and axis labels, and to avoid cluttering the plot with unnecessary information. Additionally, it is important to consider the results of the funnel plot in conjunction with other statistical tests, such as Egger's test and Begg's test. By following these best practices, researchers can create high-quality funnel plots that provide a clear and accurate view of the data. Furthermore, funnel plots can be used in conjunction with research transparency initiatives to promote accountability and transparency in research.
📊 Conclusion: The Importance of Funnel Plots in Data Science
In conclusion, funnel plots are a powerful tool for detecting publication bias in research studies. By examining the funnel plot, researchers can identify potential biases and take steps to address them, which can help to improve the quality and validity of the research. Funnel plots have a wide range of applications in data science, from clinical trials to social science research. As the field of data science continues to evolve, it is likely that funnel plots will play an increasingly important role in promoting transparency and accountability in research. By using funnel plots in conjunction with other statistical tests and data visualization tools, researchers can provide a more comprehensive view of the data and identify potential patterns and trends.
Key Facts
- Year
- 1970
- Origin
- Richard Light and Deborah Pillemer
- Category
- Data Science
- Type
- Statistical Technique
Frequently Asked Questions
What is a funnel plot?
A funnel plot is a graph designed to check for the existence of publication bias in research studies. It plots the effect size of studies against their precision, typically measured by the standard error. In the absence of publication bias, the plot should resemble a funnel, with studies with high precision clustered near the average effect size and studies with low precision spread out evenly on both sides. Funnel plots are commonly used in systematic reviews and meta-analyses to evaluate the quality of the included studies.
How do funnel plots detect publication bias?
Funnel plots detect publication bias by visualizing the distribution of study results. If the plot is asymmetrical, with more studies on one side of the average effect size than the other, it may indicate publication bias. This is because studies with significant results are more likely to be published than studies with non-significant results, leading to an overrepresentation of studies with significant results. Funnel plots can be used in conjunction with Egger's test and Begg's test to confirm the presence of publication bias.
What are the limitations of funnel plots?
Funnel plots have several limitations, including the assumption that the studies are randomly distributed around the true effect size. If this assumption is not met, the funnel plot may not accurately reflect the presence of publication bias. Additionally, funnel plots can be sensitive to the choice of statistical methods and the quality of the data. Therefore, it is essential to use funnel plots in conjunction with other statistical tests and to carefully evaluate the quality of the data before drawing conclusions. Funnel plots can be used in conjunction with sensitivity analysis to evaluate the robustness of the results to different assumptions and methods.
How can funnel plots be used in practice?
Funnel plots can be used in a wide range of applications, from clinical trials to social science research. They are particularly useful in fields where publication bias is a significant concern, such as pharmacology and psychology. By using funnel plots, researchers can identify potential biases and take steps to address them, which can help to improve the quality and validity of the research. Funnel plots can be used in conjunction with data visualization tools to provide a more comprehensive view of the data and to identify potential patterns and trends.
What are the future directions for funnel plots?
The future of funnel plots is likely to involve the development of new statistical methods and tools to improve their accuracy and usefulness. For example, machine learning algorithms can be used to identify patterns in the data that may indicate publication bias. Additionally, the development of new types of funnel plots, such as interactive funnel plots, can help to promote transparency and accountability in research. These plots can be used to visualize the results of studies in real-time, and to identify potential biases and areas for further research.
How can funnel plots be used in conjunction with other statistical tests?
Funnel plots can be used in conjunction with other statistical tests, such as Egger's test and Begg's test, to confirm the presence of publication bias. Additionally, funnel plots can be used in conjunction with sensitivity analysis to evaluate the robustness of the results to different assumptions and methods. Funnel plots can also be used in conjunction with data visualization tools to provide a more comprehensive view of the data and to identify potential patterns and trends.
What are the benefits of using funnel plots?
The benefits of using funnel plots include the ability to detect publication bias, identify potential biases, and improve the quality and validity of research. Funnel plots can also help to promote transparency and accountability in research, and provide a more comprehensive view of the data. Additionally, funnel plots can be used to identify areas where the evidence is weak or biased, and target future research efforts accordingly.